 Z9 Monitor by Z9 Systems
VMware ESXi and vCenter monitoring that answers "is it really up?"
Z9 Monitor connects to your ESXi hosts or vCenter with a read-only account and shows every VM and host on one live board – including the VMs that vSphere still calls "running" but that stopped answering.
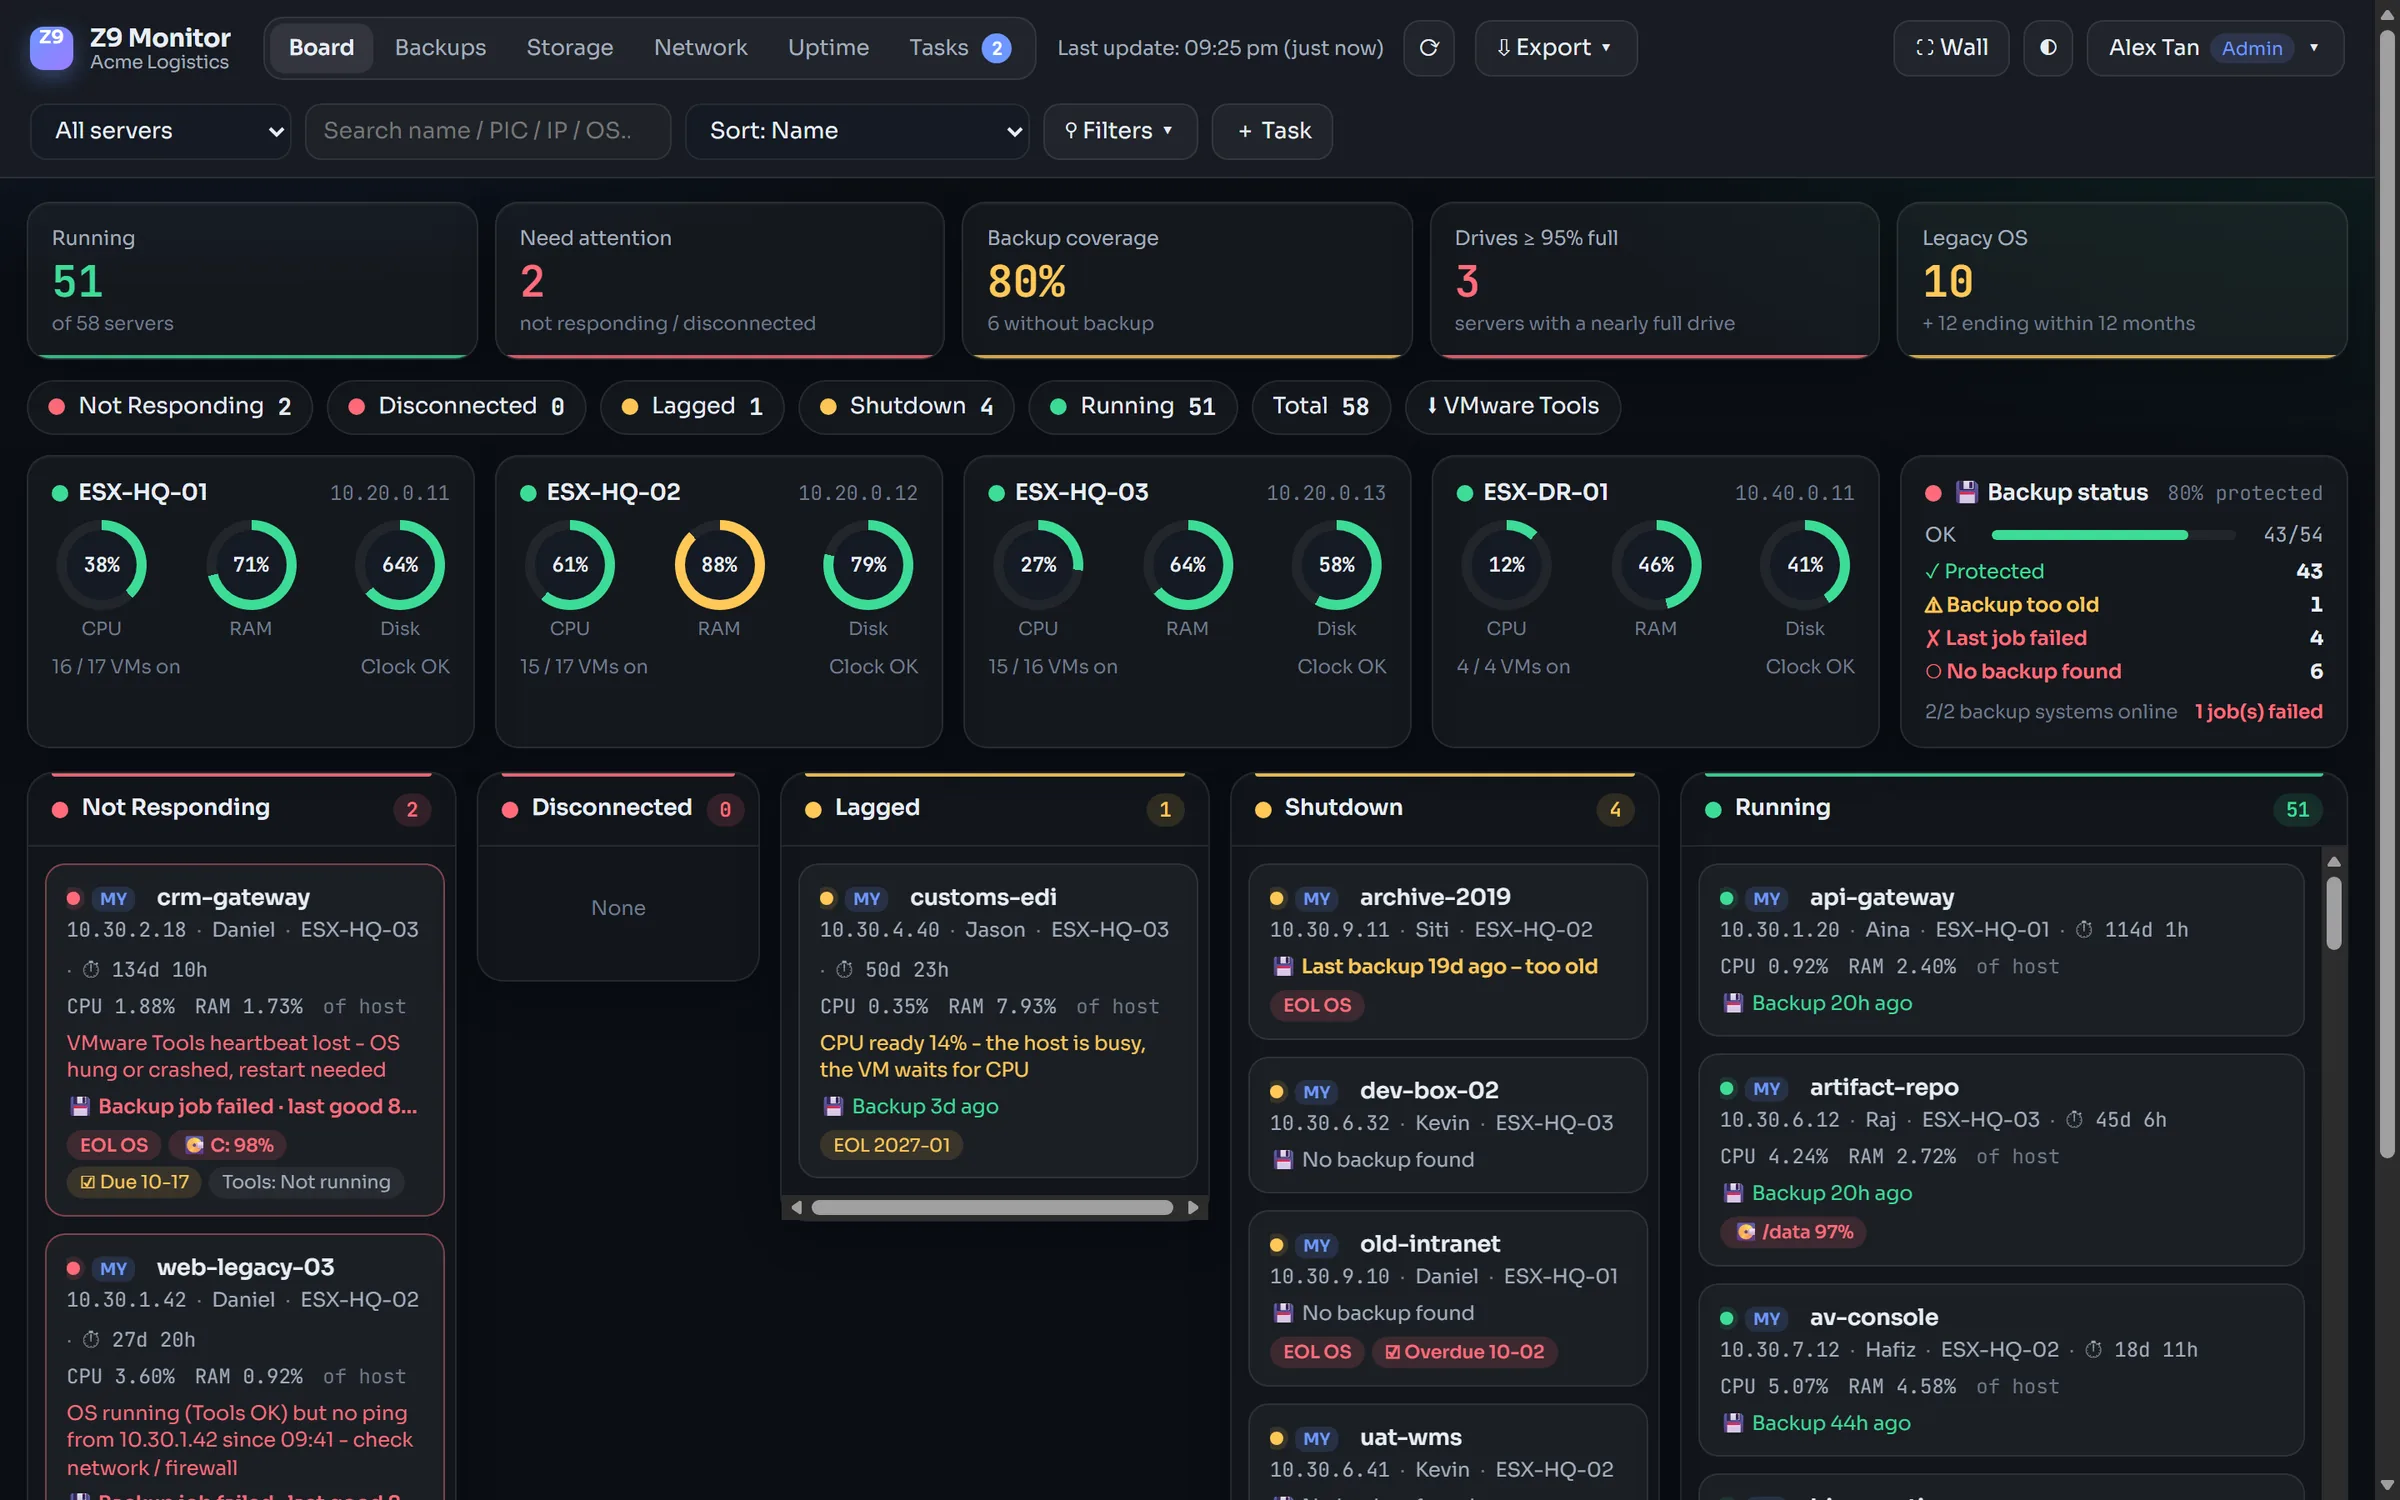
The board: host gauges on top, every VM in a status column. Demo company with sample data.
Hung VMs are shown as down – not as "running"
A VM can be powered on while Windows is frozen or a Linux kernel has panicked. Every 15 seconds Z9 Monitor combines the power state, the VMware Tools guest heartbeat, ping and an RDP / SSH port check. When the guest stops answering, the VM moves to Not responding and the owner is alerted – with the reason, for example "VMware Tools heartbeat lost – OS hung or crashed".
Hosts, datastores and guest drives
- ESXi hosts – CPU, RAM and datastore gauges per host, VMs on each host, and a clock check (time drift breaks backups and sign-in).
- Datastores – local, SAN and NFS datastores once, even when they are shared by every host, with a forecast of when each one is full.
- Drives inside the VMs – C:, D:, /data and every other drive from VMware Tools every ten minutes, with "full in N days" at the current growth.
- VMware Tools – VMs where the tools are missing or not running, with a task for the owner to fix it.
- Operating systems – every guest OS checked against its end-of-support date.
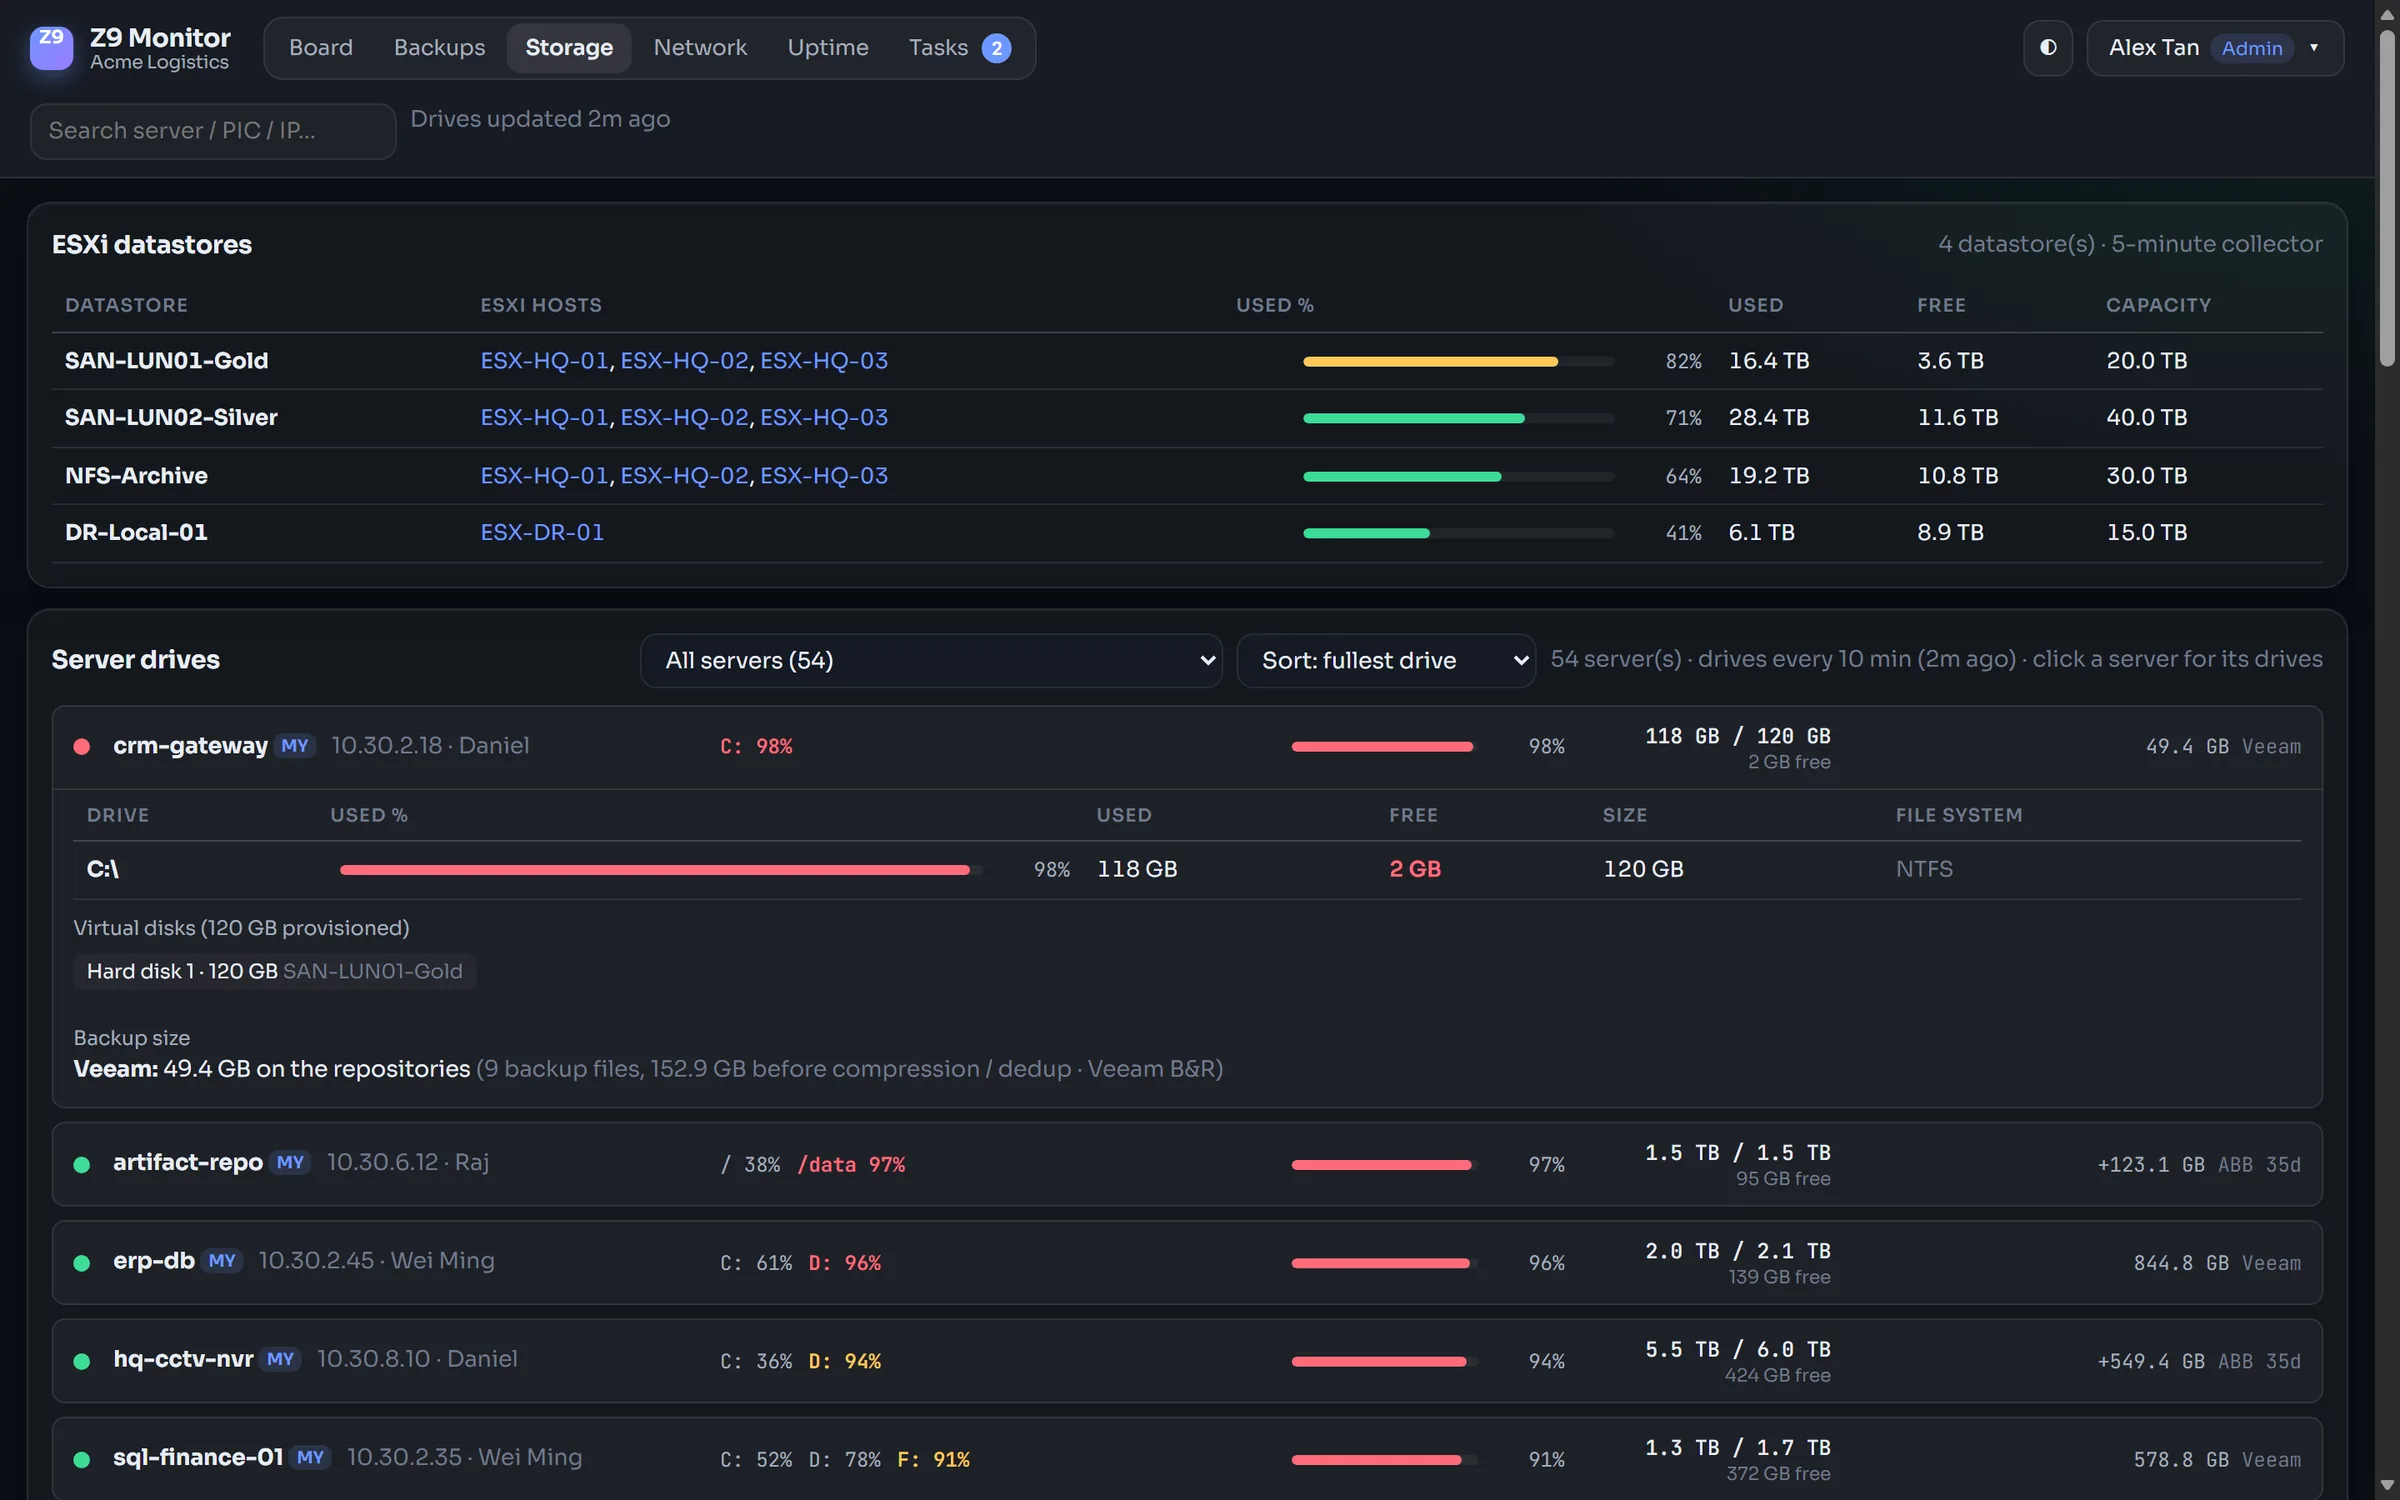
Storage: every datastore with the hosts that use it, and the fullest drives first.
Moving away from VMware? Watch both sides during the move
Many companies are moving some or all workloads to Proxmox VE or Microsoft Hyper-V. Z9 Monitor reads all three at the same time, so the old and the new hosts stay on one board with the same alerts while you move – and you can see at a glance what is still left on the old hosts.
Is it backed up?
Next to each VM the board shows its last Veeam or Synology Active Backup restore point, and lists every VM without a recent backup. See backup monitoring.
What you need
- ESXi 7.x or 8.x – standalone hosts or vCenter. A read-only vSphere account is enough: Z9 Monitor never changes anything.
- One Windows Server VM (2019 or newer) inside your network. Monitoring data stays there – nothing is sent to the cloud.
- About 15 minutes: the quick setup finds all hosts and VMs. Step by step: install guide.
Licences are counted by servers: each VM and each ESXi host counts once – no sensors to count. See editions and prices.